Node-RED guide series
Node-RED Nodes
Learn about some of the most important nodes, have a look at their properties, learn how to configure them and learn how to install third-party nodes that are available in the Node-RED library.

In this article, I will show you some of the most important nodes, have a look at their properties, learn how to configure them, and learn how to install third-party nodes that are available in the Node-RED library.
The nodes toolbar
On the left toolbar, you can see the list of default or built-in nodes that come with a fresh installation of Node-RED. You can add more nodes from the Node-RED library, and, of course, create your own nodes.

All available nodes are available from the left toolbar.
Node example: "debug"
A very common node called "debug". Find it under "common" and drag it on to the flow canvas. The purpose of the "debug" node is to output text to the debug window that can appear on the right toolbar.
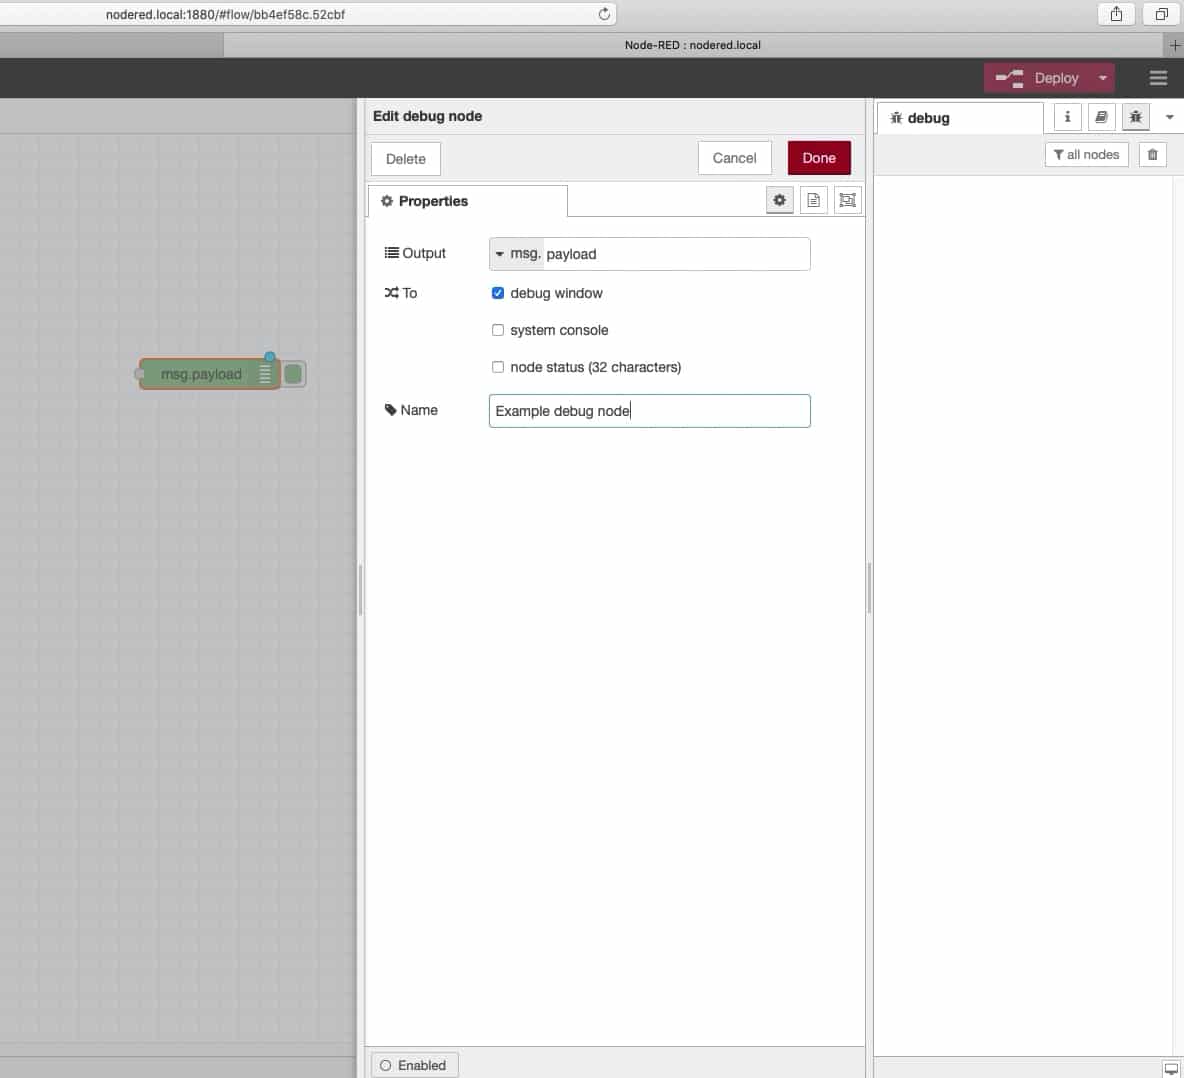
In the image below, you can see a debug node on the canvas, with its properties tab and output tab open.

The "debug" node with its properties tab and output tab open.
To reveal the properties of any node, double-click on the node. This will reveal the edit pane. Depending on what kind of node it is, the properties tab will have its own configuration options and set of widgets that you can interact with toset up the node.
The debug node allow us to send a string of text to the debug pane that you can see in the image above. The string that is shown in the debug pane is passed on to the debug node from the previous node in the same flow. Of course, you can configure exactly what it is that your want the debug node to output.
The debug node is one of the most commonly used nodes in Node-RED flows. It is the equivalent of the "Serial.print()" function of an Arduino sketch.
Keep in mind that a debug node can send a string to the debug pane, but also to the system console. In most cases, you want to send it out to the debug console. You may want to send debug messages the system console, which is particularly useful if you are running Node-RED on the command line.
You can customize the name of a node. In this case, I'll call this debug node "example debug node." Just type the name you want in the "Name" attribute of the node.
You should always give your nodes appropriate names to make it easy to understand what is happening in a flow. This is similar to how we want to give reasonable names to variables and functions in a text programming language.

Give nodes reasonable names.
Node information
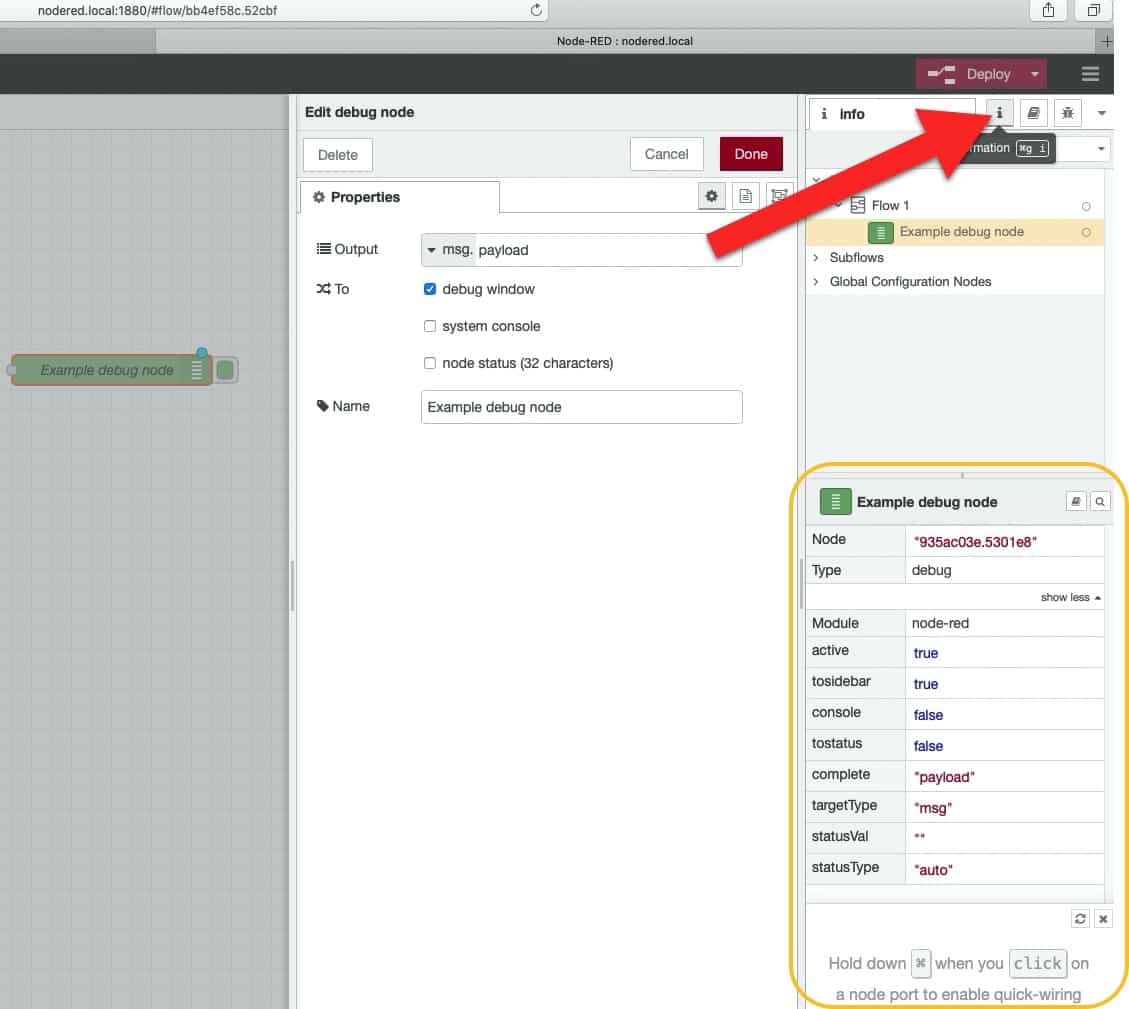
You can get information about the properties of a node by clicking on the "i" button. This will reveal the "info" tab.

Use the Info tab to see the node properties.
The information that you will see in the info tab depends on the type of node you are looking at, but all nodes have at least these attributes: node ID, type, and active.
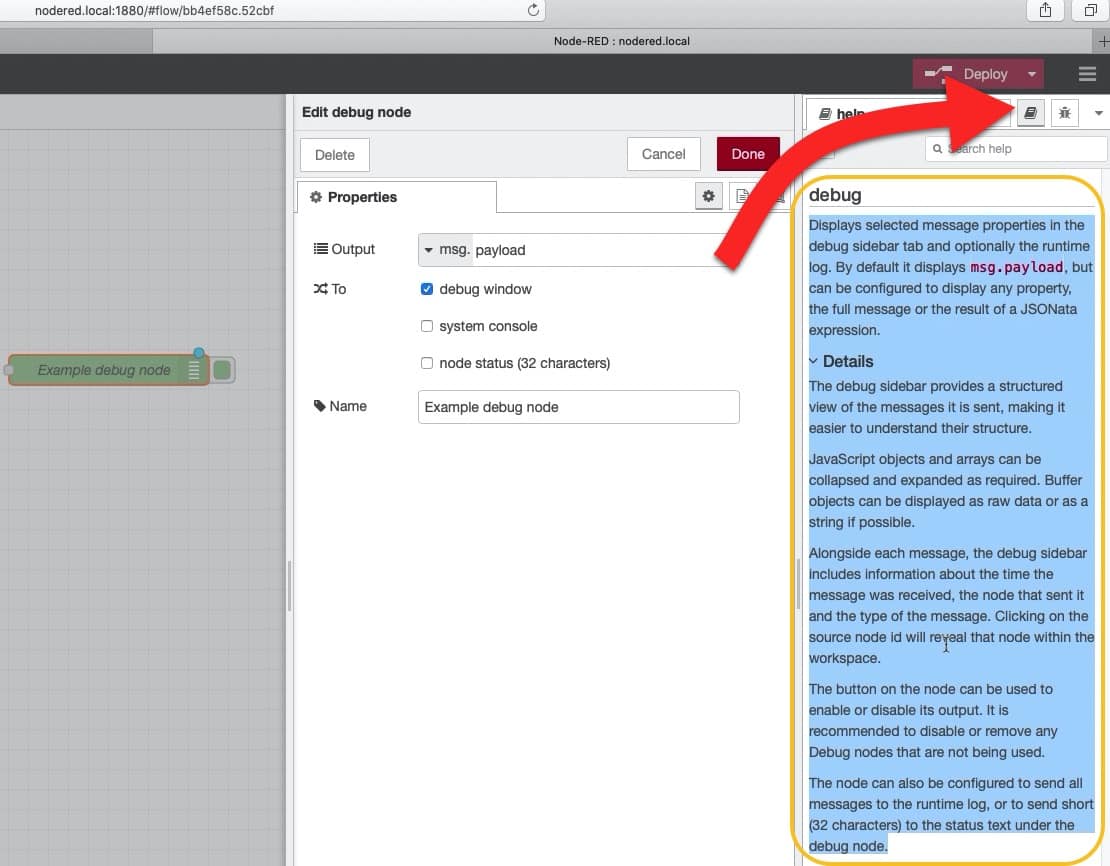
Node documentation

Use the "Help" tab to see the node documentation.
Node example: "inject"
Let's have a look at another node: inject.
The "inject" node is useful when you want to inject a string into another node.
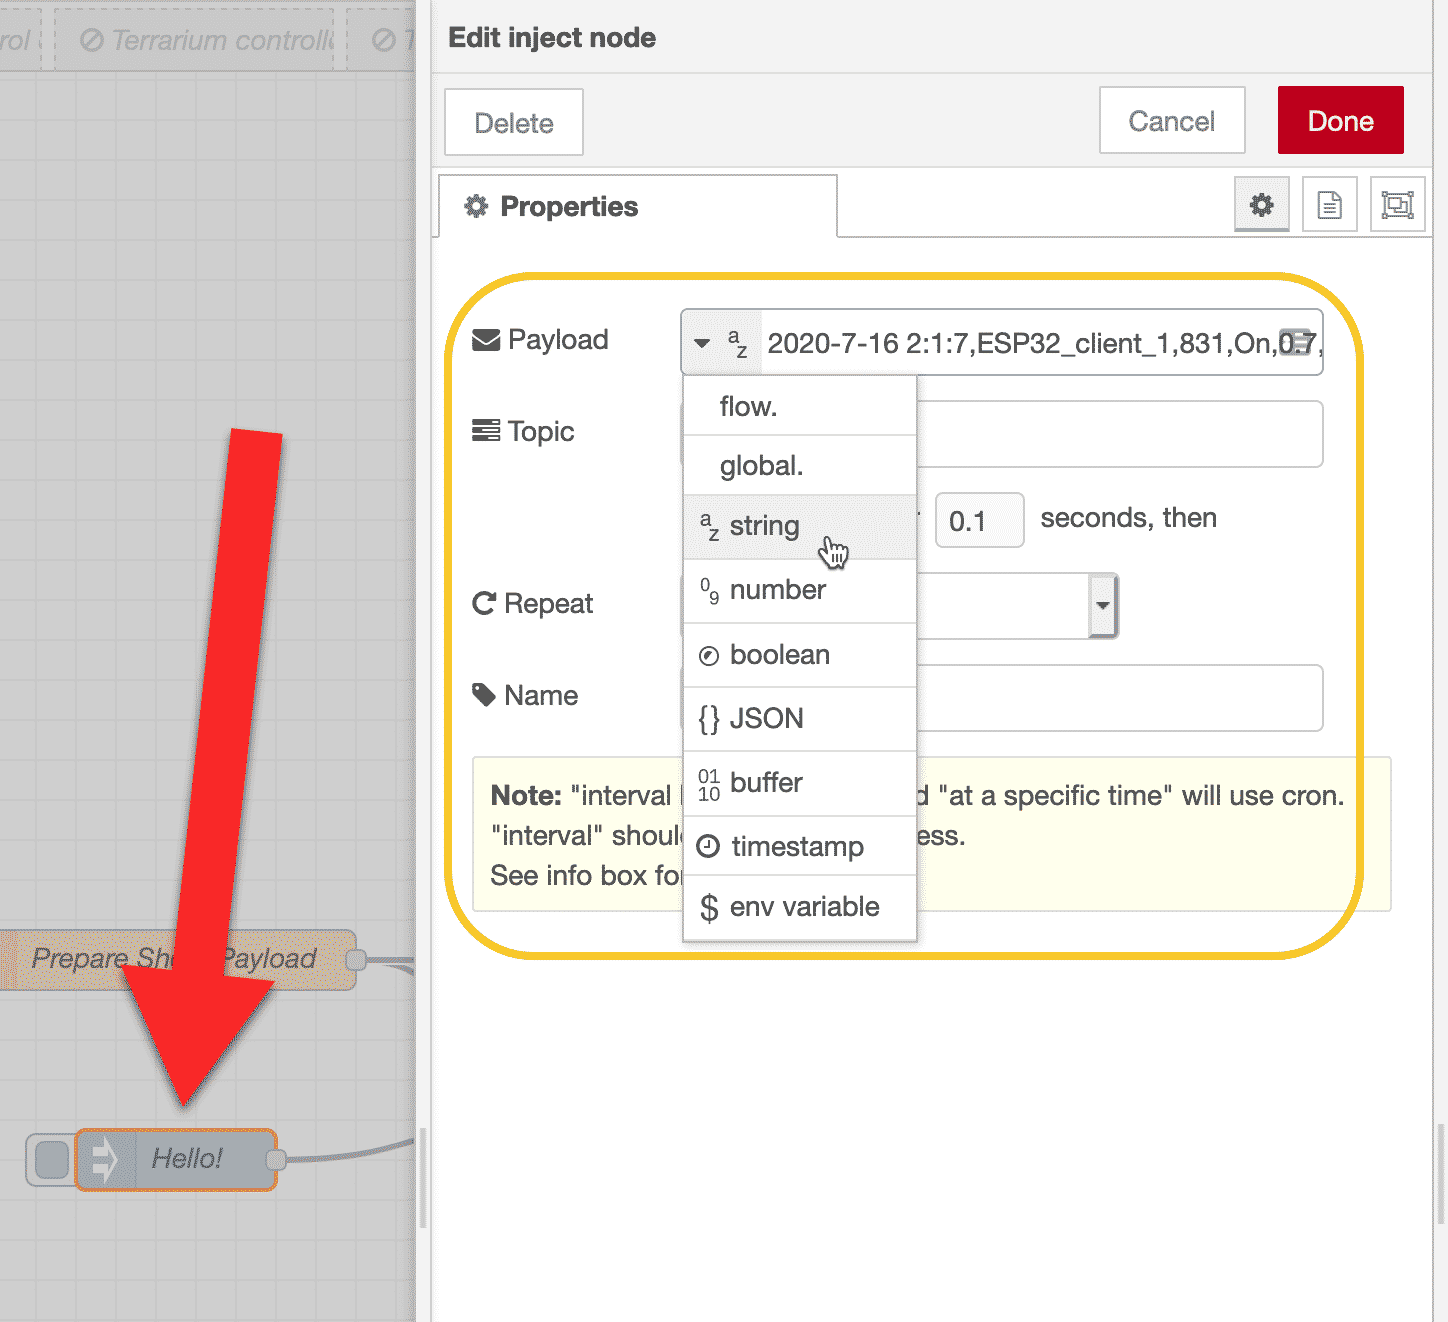
In the example below, I have exposed the Edit pane of an inject node named "Hello". In the properties tab, you can see the various types of payloads that the inject node can inject to another node (such as the "debug" node).
The payload can be a fixed string, a number, a boolean, a JSON expression, a flow variable, among other things.
In the example below, I have set the payload to a fixed string as part of my testing along side a Google Sheet node.

The arrow points to the Hello "inject" node.
Manage palettes

Manage palettes from the burger menu.
Via the Manage Palette tool you can install contributed flows, nodes or collection of nodes.
A particularly useful collection of nodes that I will be using a lot in this project is called "node-red-dashboard". To install it, simply search for "dashboard", find it in the list with the search results, and click on "install".

The "node-red-dashboard" node.
While you are in the Palette Manager, also search for and install the "dht22" node (look for the one named "node-red-contrib-dht-sensor").
The new nodes will appear in the left tool bar. Here's what the new nodes for the dashboard look like:

These nodes below to the dashboard group.
You can use these nodes in your flows to create dashboards like this:

An example Node-RED dashboard.
Settings
You can access the Settings pane from the burger menu:

Access the Settings pane from the burger menu.
From the Settings pane, you can configure your working area, the application language, the grid size, etc. You can also set your favorite keyboard shortcutts.

The User Settings pane.
In order to make nodes do something useful, we need to connect them together into flows.
In the next article in this series, I will to show you how to create simple flows using a handful of basic nodes.

Learn Node-RED and how to use it with the ESP32
This course will guide you through the construction of an automated control system. The deliverable is a Terrarium controller.
Along the way, you will learn a great deal about useful technologies such as the Node Red programming environment and MQTT.
Jump to another article
1. Introduction to Node-RED
2. Install Node-RED on the Raspberry Pi
3. Configuration
4. Nodes
5. Flows
6. Messages and Variables
7. The "complete" node
8. The "catch" node
9. The "link out" and "link in" nodes
10. The "switch" node
11. The "range" node
12. The "delay" node
13. The "trigger" node
14. The "RBE" (Report by Exception) node
Last Updated 1 year ago.
We publish fresh content each week. Read how-to's on Arduino, ESP32, KiCad, Node-RED, drones and more. Listen to interviews. Learn about new tech with our comprehensive reviews. Get discount offers for our courses and books. Interact with our community. One email per week, no spam; unsubscribe at any time