Node-RED guide series
Node-RED Flows
Nodes, on their own, are not very useful. For them to be useful, they must to be connected and configured inside flows.
In this article, I will show you how to create your first Node-RED flows.

In the previous article in this series, I did quick introduction of Node-RED nodes. On their own, nodes are not very useful. For them to be useful, they must to be connected to other nodes and configured inside flows.
In this article I'm will show you a few simple examples of nodes configured into flows to help you get started. For the examples that follow, I will be using the DHT22 node. For this purpose, I have connected a DHT22 sensor to my Raspberry Pi.
If you don't know how to connect a DHT22 sensor to your Raspberry Pi, please read this article from the Raspberry Pi guides series.

My Raspberry Pi2 "wearing" my DHT22 HAT.
Create a new flow
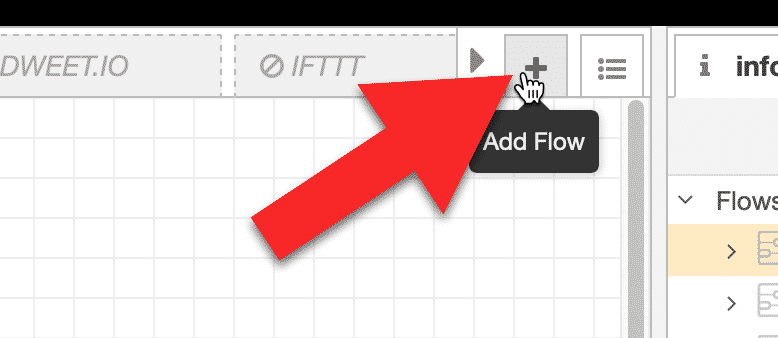
To create a new flow, click on the "+" button, on the top right corner of the designer canvas.

Create a new flow.
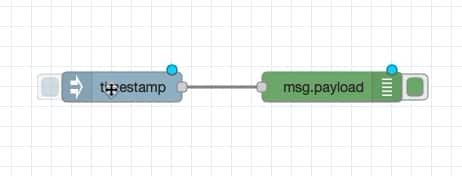
This flow will contain only two nodes: "inject" and "debug". Find the two nodes unde the "common" group, and arrange them in the canvas like in the screenshot below:

A flow with two nodes.
This flow will perform this operation: when I click on the inject node button, the string "HELLO", will be sent over to the next node. In this case, the next node is the "debug" node, which will print the message in the debug window.
The inject node is on the left, and the debug node on the right. Connect them by clicking and holding on the circle of the inject node, then place the mouse pointer over the circle of the debug note, and release.
Next, configure the inject node. Double-click on it to reveal its properties.
In the "msg" field, select "payload", and for the payload type select the string option (designated by the "az" icon).
In the payload field, type "HELLO".
Click on "Done" to exit the inject node pane.

The inject node properties.
Next, double-click on the debug node. There's only a couple of attributes to set.
The first one is the "output". In the "inject" node, you stored the string in the "msg.payload" variable. Therefore, in the debug node, you should read the output from the "msg.payload" variable.
Also, in the Name attribute, give this node the name "Example debug node".
The debug node edit pane will look like this:

The "debug" node properties.
Let's test out the new flow. Click on the red Deploy button:

Click on "Deploy" to execute the flow.
Your flow is now running. Click on the button of the inject node, and notice that the string "HELLO" appears in the debug pane.
If the debug pane is not visible, click on the small button with the bug icon.
The debug pane will show a new message each time you click on the inject node button. The message will include a timestamp, the name of the debug node that printed it, and the name of the variable that contained it ("payload").
Also notice that each time that you click on the inject button, a green notification appears in the Node-RED editor window.

The outcome of this simple flow.
A flow with the DHT22
Let's try another flow. In this flow, we'll use the DHT22 node to get a temperature reading from the sensor. We'll use a debug node to show the temperature.
I'd like to get a new reading every 10 seconds, so I will add a trigger node to the flow. Finally, I'd like to trigger the flow manually, so I'll use an inject node which has a very useful button.
Here's the flow, assembled:

This flow will display the temperature in the debug window, every 10 seconds.
Below I provide the configuration of each node.

The trigger node.

The DHT22 node.

The debug node.

The inject node.
Once you assemble the flow, click on "Deploy" and then click on the inject button to start the trigger. After this, a new temperature value will appear in the debug window, every ten seconds.

The flow outcome.
You can see the process of putting the flow together in detail in the video. This experiment begins at approximately 5 mins and 40 seconds in the video.
A flow with a function node
Let's try an experiment that involves a flow with a function node. Function nodes are very useful and very flexible: you can write custom JavaScript that will run inside the node, and process inputs in any way you want.
The flow in this experiment will contain an inject node, a function node, and three debug nodes. It will demonstrate how you can do simple processing using JavaScript and drive three outputs.
The flow looks like this:

A simple flow that contains a function node.
The function node is in the middle of the flow. Notice that it has three outputs, and those are connected to the debug nodes. One debug node actually receives input from two function node outputs. This design is legitimate.
In the video in this article you can see, in detail, how I assemble this flow. The relevant part starts at around 14 minutes and 20 seconds in.
What is most interesting in this flow, is the JavaScript in the function node, and its configuration.
It looks like this:

This function node has three outputs.
The JavaScript is very simple. It contains three local variables, msg1, msg2 and msg3. Each contains a small JSON document, with a payload and a one-character string in it.
The return statement is an array with three fields.
At the bottom of the Edit pane, I have set the number of outputs to three, as many as there are fields in the return array.
Each field of the return array becomes an output.
The first field is outputted from the top output in the graphical symbol of the function node.
The second field is outputted from the middle output.
And the third field is outputted from the bottom output.
Isn't this neat?
Functions, of course, are extremely powerful.
Anything you can do with JavaScript, any kind of program you can imagine, you can go in here to do processing for various inputs and then to create appropriate outputs for further down into the flow.
Let's move on to the next article where you will learn about Node-RED variables.

Learn Node-RED and how to use it with the ESP32
This course will guide you through the construction of an automated control system. The deliverable is a Terrarium controller.
Along the way, you will learn a great deal about useful technologies such as the Node Red programming environment and MQTT.
Jump to another article
1. Introduction to Node-RED
2. Install Node-RED on the Raspberry Pi
3. Configuration
4. Nodes
5. Flows
6. Messages and Variables
7. The "complete" node
8. The "catch" node
9. The "link out" and "link in" nodes
10. The "switch" node
11. The "range" node
12. The "delay" node
13. The "trigger" node
14. The "RBE" (Report by Exception) node
Last Updated 1 year ago.
We publish fresh content each week. Read how-to's on Arduino, ESP32, KiCad, Node-RED, drones and more. Listen to interviews. Learn about new tech with our comprehensive reviews. Get discount offers for our courses and books. Interact with our community. One email per week, no spam; unsubscribe at any time