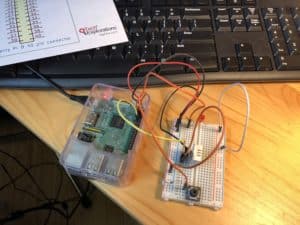
The Internet is comprised from an odd collection of hardware devices, software programs (code), and networking components connected together over the air and through physical conduits enabling a modern world access to goods, services, and information almost instantaneously. Most of us have very little idea of how any of this works!
The Raspberry Pi Full Stack Raspbian course is a second generation offering from Tech Explorations delivering a whirlwind tour of how the Internet works. When finished a student will understand how a Raspberry Pi is used to remotely monitor and archive temperature and humidity at home from any web browser, from any location in the world. The end-to-end process is no different than services offered by any of the major commercial services, except the student builds and has complete control and access to the entire system. This particular posting assumes the user is also studying the Raspberry Pi Full Stack Raspbian course.
Having studied this course for some time, I keep discovering processes that I’ve successfully completed, but details I do not fully understand. When I encounter one of these details my problem solving strategy is to extract the key code from the project, examining it, modifying it, play with it in a simple form to see how it works then put it back into the project. The purpose of this and future postings will be to share my thoughts and study the feedback to understand a process fully.
Much of what I work with professionally (I teach Network Engineering) deals with examining list and dictionary formatted information using various vendor specific APIs (Application Programming Interfaces). Ultimately, after the Internet conduits have connected the hardware, all that remains is the code and more specifically the API code. APIs connect to other APIs with the result being some sort of a service. In the context of the Tech Explorations Raspberry Pi Full Stack (RPiFS) project, sophisticated monitoring, archiving, and dynamic plotting of environmental information.
The example code that follows uses Python interactive commands and a short Python program to query the RPi-FS SQLite3 lab_app.db database. Then with some filtering and formatting, extracts the 20 latest temperature/ humidity values from the lab_app.db.
Interactive commands displaying all records using Python CLI:
Link to Interactive Command Listing on GitHub (open in a new tab)
(lab_app) root@RPiFSv2:/var/www/lab_app# python3
import sqlite3
conn=sqlite3.connect(‘/var/www/lab_app/lab_app.db’)
curs=conn.cursor()
curs.execute(“SELECT * FROM temperatures”)
#NOTE: This is informational feedback. Don’t Type
temperatures = curs.fetchall()
print (temperatures)
conn.close()
exit()
myDBquery.py program to query the lab_app.db SQLite3 DB:
Link to myDBquery Code Listing on GitHub (open in a new tab)
#
myDBquery.py
Rich Park February 09, 2019
A program to query the temperature and humidities
from the RPiFSv2 Database
#
import sqlite3
import os # Allow for calls to the shell
os.system(‘clear’) # This call clears the screen. Very helpful for avoiding testing clutter.
conn=sqlite3.connect(‘/var/www/lab_app/lab_app.db’)
curs=conn.cursor()
curs.execute(“SELECT * FROM temperatures”)
temperatures = curs.fetchall()
curs.execute(“SELECT * FROM humidities”)
humidities = curs.fetchall()
conn.close()
Get the 20 most recent temperature and humidity readings
#######################################################
# myDBquery.py                                        #
#   Rich Park February 09, 2019                       #
#   A program to query the temperature and humidities #
#   from the RPiFSv2 Database                         #
#######################################################

import sqlite3
import os # Allow for calls to the shell

os.system('clear') # This call clears the screen. Very helpful for avoiding testing clutter.

conn=sqlite3.connect('/var/www/lab_app/lab_app.db')
curs=conn.cursor()
curs.execute("SELECT * FROM temperatures")
temperatures = curs.fetchall()
curs.execute("SELECT * FROM humidities")
humidities = curs.fetchall()
conn.close()

# Get the 20 most recent temperature and humidity readings
for item in range ((len(temperatures) - 20), len(temperatures)):
        # Do a bit of formatting to make the output more readable.
        # NOTE: the u"\u2103" entry displays the 'degrees centigrade symbol.
	print (item," Temperature -> ", str(("{:.2f}".format)(temperatures \
                [item] [2])),u"\u2103","  ", (temperatures[item][0]), sep='')
	print ("         Humidity    ", str(("{:.2f}".format)(humidities \
                [item] [2])),"%", sep='')
Sample Run of myDBquery
20 (edited) most recent temperature/humidity values:
Link to lab_app.db Sample Run Query Listing on GitHub (open in a new tab)
##############- SAMPLE RUN -#################################
 # Over 25,000 records had been collected at this time.

(lab_app) root@RPiFSv2:/var/www/lab_app# python3 myDBquery.py

24983 Temperature -> 22.40℃  2019-02-03 18:50:02
         Humidity    46.50%
      < clipped for brevity >
25000 Temperature -> 23.40℃  2019-02-03 21:40:02
         Humidity    46.90%

(lab_app) root@RPiFSv2:/var/www/lab_app# 