Oscilloscopes For Busy People guide series
Example Waveforms
In this article I'll show you some of the waveforms that you will typically see with your oscilloscope. Sine, square, triangular and step waveforms are examples of signals that we commonly see.
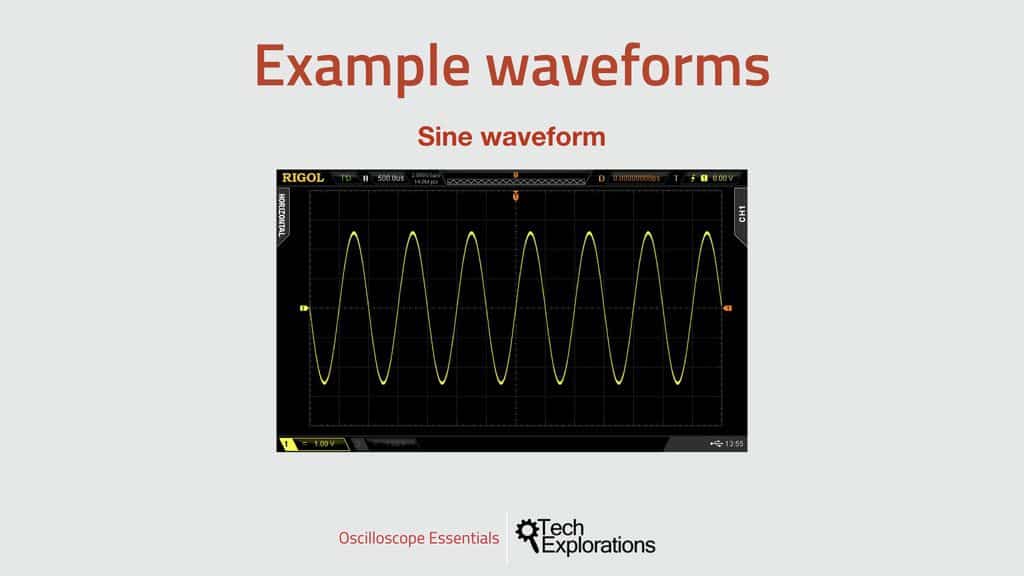
In this article I'll show you some of the waveforms that you will typically see with your oscilloscope.
There’s a few that you’ll see most often, but also some rare ones worth knowing about.
Oscilloscopes can display an infinite number of waveforms. All you have to do is to so supply it with some kind of voltage signal that changes over time, and it will display it on the screen.
However, there are certain waveforms that are regularly encountered in electronics.
Sine, square, triangular and step waveforms are examples of signals that we commonly see.
Let’s have a look at these, plus a few more.
The sine wave
 The sine wave is one of the most common waves you’ll see in an oscilloscope.
A sine wave is one of the most common waves you’ll see in an oscilloscope. A sine wave describes a continuous and smooth periodic oscillation. In comparison, the square wave, that you’ll see next, switches from one voltage level to another very abruptly.
The square wave
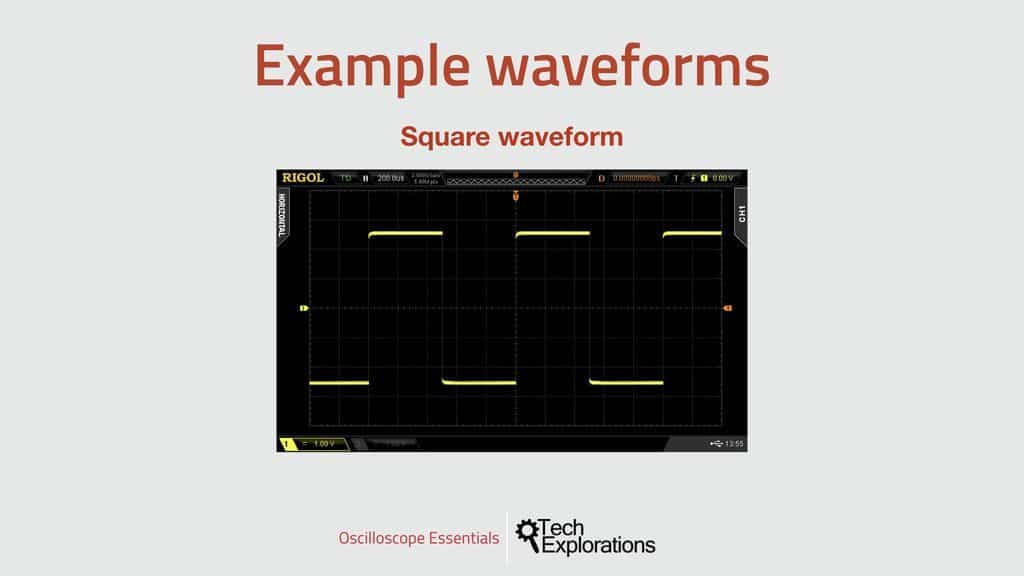 The square waveform (or is close relatives, such as the pulse), is the waveform that we work with the most
When we work with digital electronics, the square waveform (or is close relatives, such as the pulse), is the waveform that we work with the most. Digital electronics work with just a couple of voltage levels, high and low, and they tend to switch between these levels very quickly. Hence, in the oscilloscope they produce waveforms that look square.
The example you are looking at is almost perfect because it was produced by a signal generator. The signal generator is a device specifically designed to create very clear signals. As you’ll see later in this course, real square waves are much noisier, but still work well for the purpose of transmitting information.
Let’s have a look at an example of a relative to the square wave next…
The pulse wave
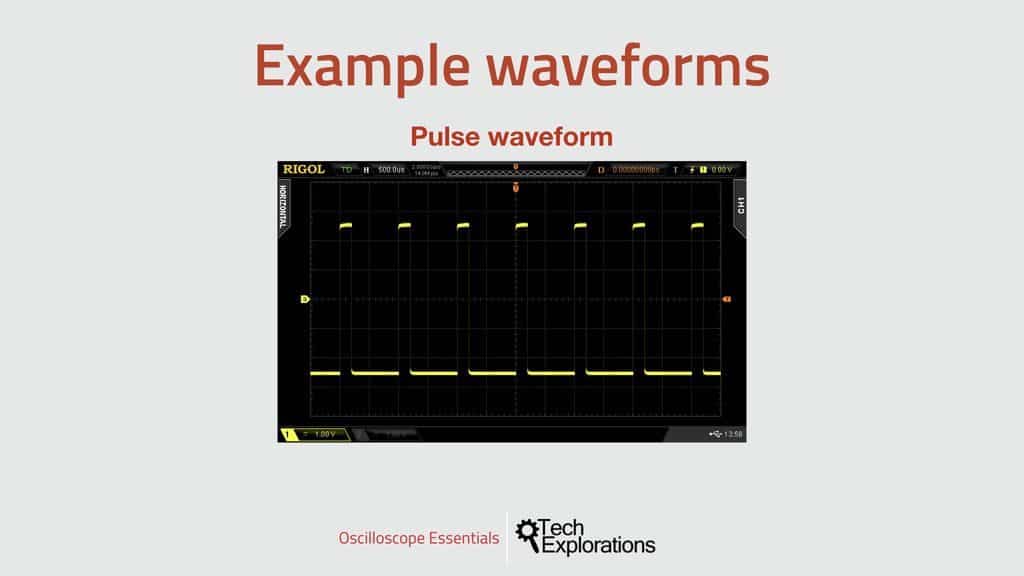
This is the pulse waveform.
This is the pulse waveform.
It’s called that because its voltage level is at low most of the time, and then is switches to High for a very brief amount of time before it goes back to Low. Of course, you can have the opposite, ie. a wave that spend most of its time at high and then switches to low for a brief amount of time.
The triangle wave

The triangular waveform.
The triangular signal has the voltage going up and down with a straight and regular slop. You can modify a triangular signal to produce a sawtooth or ramp waveform. I’ll show you an example in a minute.
Noise
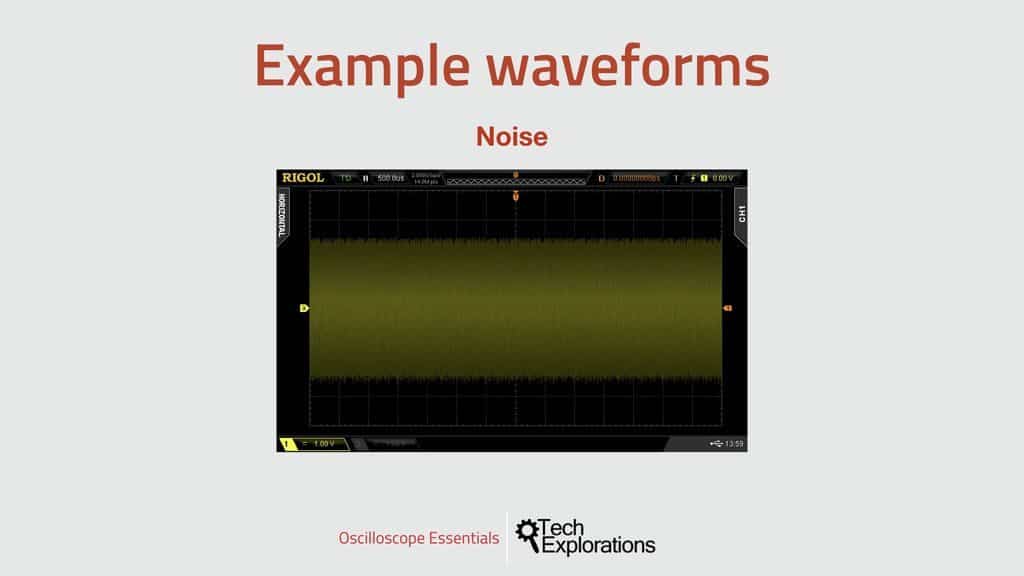
Noise.
Noise (not really a wave).
You can see something like this when the probes are connected to something that is noisy, or generates noise.
But you can also see a “noisy” signal if you are trying to display a non-noisy signal where the trigger is not properly set. The trigger is an important function and concept without which you cannot effectively operate your oscilloscope. You will learn about triggers later in this course.
Ramp waveform
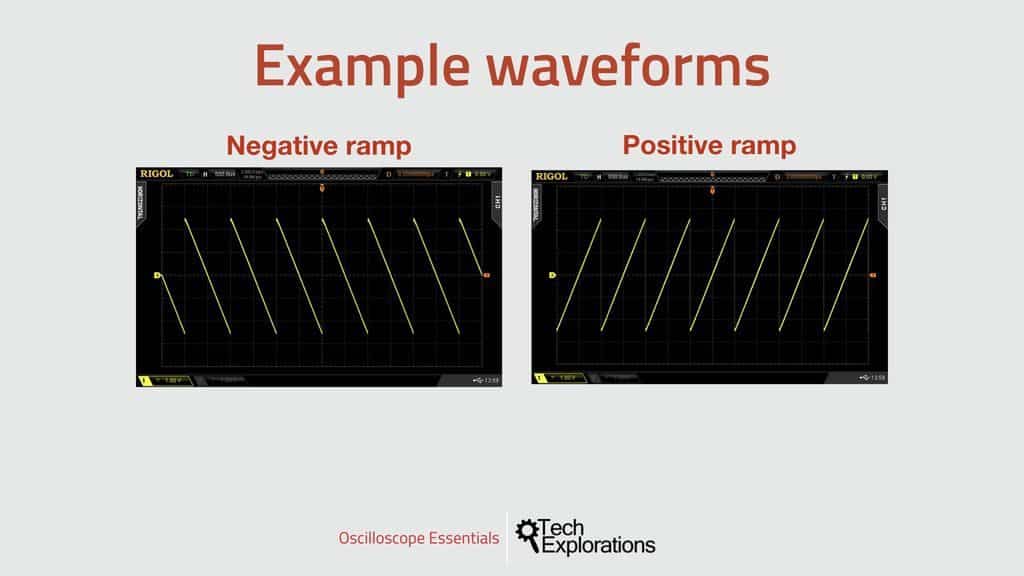
Ramp or Sawtooth waveform.
The Sawtooth (or ramp) is a relative of the triangular wave. Just remove one side of the triangle, and you get a ramp that is rising (positive) or falling (negative).
Stair waveform
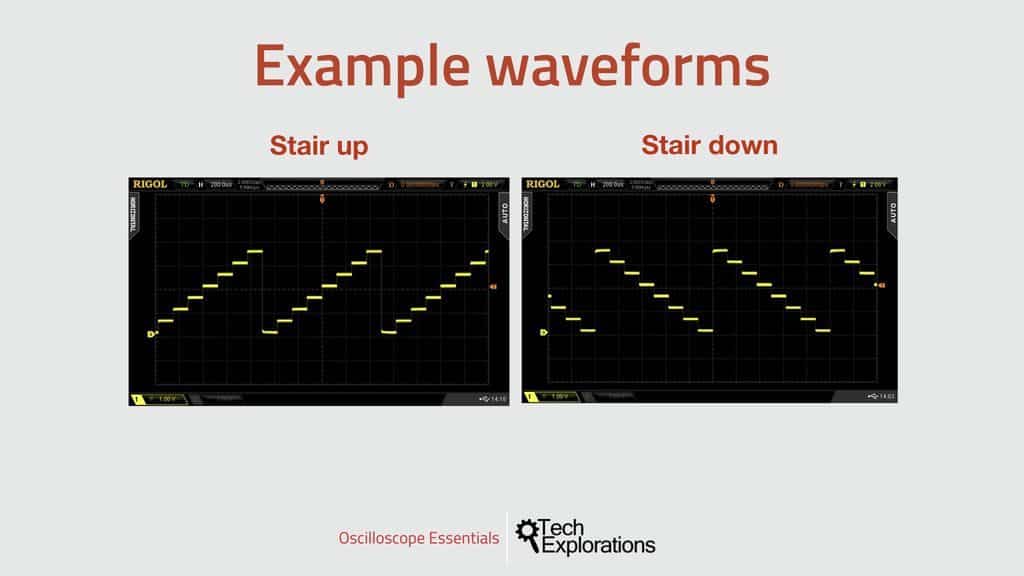
The stair waveform.
The stair waveform is a bit like the square waveform but instead of two levels, it has multiple. Like the ramp, we have stair waveforms that go up or down. In either case, the voltage level will switch to the very next level in the sequence.
You can also think of a stair waveform like a ramp. While a ramp is continuous (that is, it has an infinite number of in-between voltage levels), the stair has a finite number of voltage levels.
Other waveforms
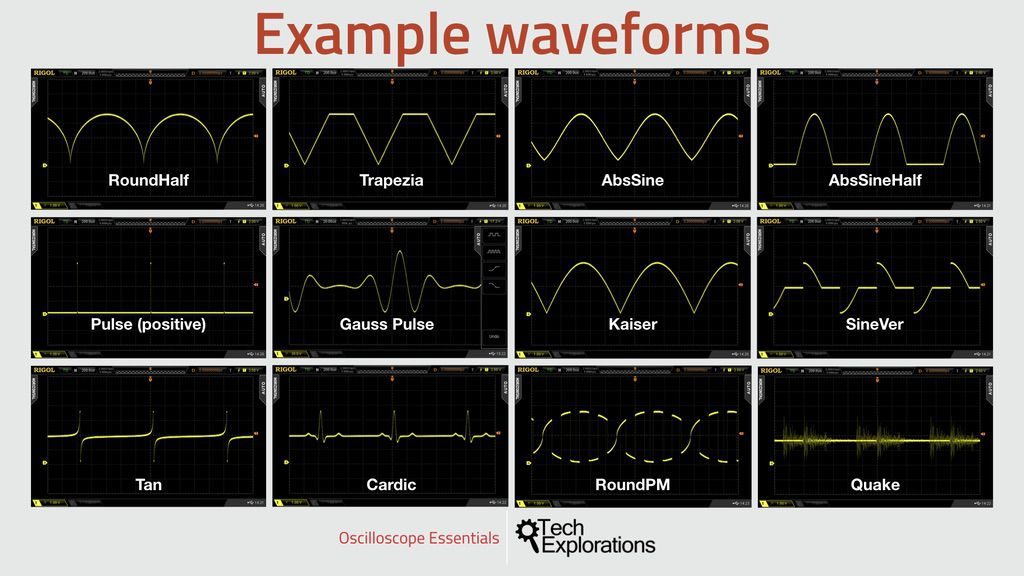
Other waveform examples.
In this slide I just want to show you some examples of the many other possible waveforms, and how they look in the oscilloscope. All of them are produced by the signal generator and are very rare in practice when you work with electronics, especially digital electronics (at least in my experience).
The one in the bottom right, the Quake waveform, depicts an actual earthquake. Your oscilloscope will be able to produce waveform is you connect appropriate probes that can detect earth tremors. Similarly, the second example in the bottom row, the Cardic waveform, is an actual waveform produced by the operation of a heart. Your oscilloscope can show your heart operation if you connect the appropriate probes .
Remember, any signal that changes over time, can be displayed by the oscilloscope.
X-Y waveform or "Lissajous figures"
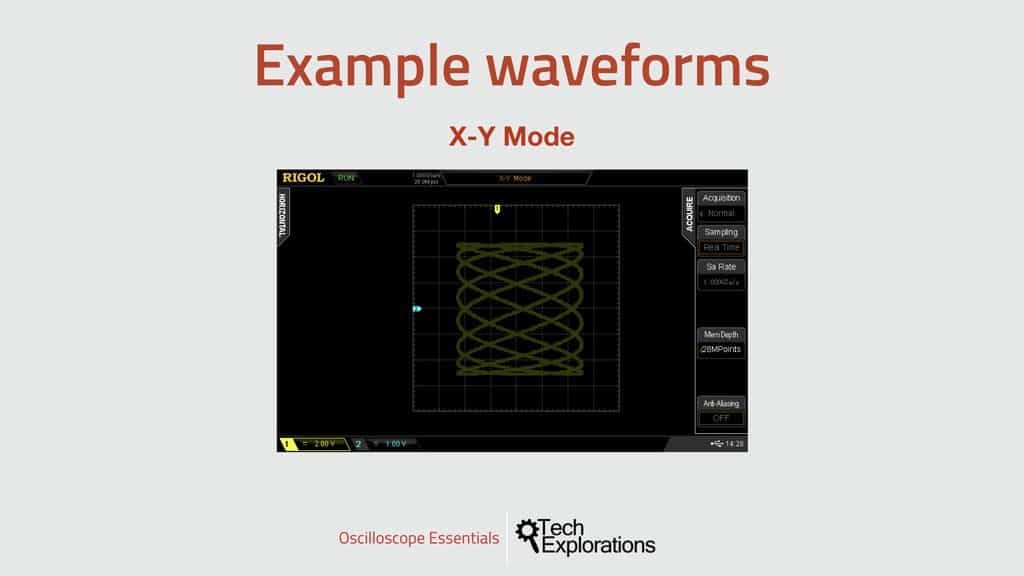
Lissajous figures
Most of the time, you will be working in Y-T (Y over time) mode. That is the mode that you will use to display the waveforms you saw in the previous slides.
Most oscilloscopes, however, are also capable to operate in X-Y mode.
In X-Y mode, the oscilloscope takes input from both channels and creates a graph that combines the two signals in two dimensions. The signal coming through the first channel is used to control the X axis, while the signal from the second channel controls the Y axis.
In normal Y-T mode, the signal from either channel is used to control what is displayed in the Y axis whereas time controls what happens in the X (horizontal) axis.
The resulting graph is often called “Lissajous figures”. You are looking at an example in this slide. Later in this course, I will show you how to create such a figure.

Ready for some serious learning?
Enrol to
Oscilloscopes for Busy People
Demystify the oscilloscope and learn how to use it in your projects.
This course is perfect for people who have never used an oscilloscope.
Through a series of projects, this course will teach you how to use an oscilloscope to measure and decode signals in your electronics.
Just click on the big red button to learn more.
Last Updated 1 year ago.
We publish fresh content each week. Read how-to's on Arduino, ESP32, KiCad, Node-RED, drones and more. Listen to interviews. Learn about new tech with our comprehensive reviews. Get discount offers for our courses and books. Interact with our community. One email per week, no spam; unsubscribe at any time
